Back
21 Feb 2020
WTI Price Analysis: 200-bar SMA, 50% Fibonacci guard immediate upside
- WTI declines from the key upside barrier, snaps two-day winning streak.
- 38.2% Fibonacci retracement holds the gate for mid-February tops.
- January 24 high can lure the bulls during further upside.
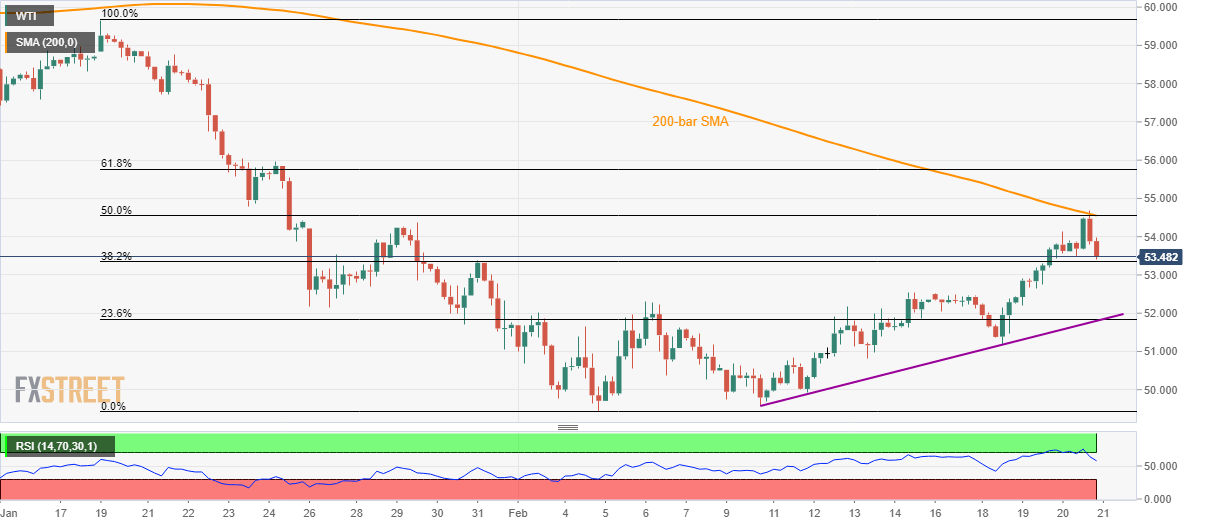
WTI steps back from the four-week high to $53.58 during Friday’s Asian session. In doing so, 38.2% Fibonacci retracement level of its January-February downside grabs the market attention.
Should oil prices remain weak below $53.35 immediate support, the mid-month tops nearing $52.50 and February 06 high close to $52.30 can entertain the sellers.
During additional south-run past-$52.30, 23.6% Fibonacci retracement and an ascending trend line from February 10, near $51.80, will be important to watch.
On the upside, 200-bar SMA and 50% Fibonacci retracement act as the tough resistance around $54.55.
In a case the black gold manages to cross $54.55, January 24 high close to $56.00 can return to the charts.
WTI four-hour chart
Trend: Pullback expected