Confirming you are not from the U.S. or the Philippines

Mit der Abgabe dieser Erklärung erkläre und bestätige ich ausdrücklich, dass:
  • Ich kein Bürger oder Einwohner der USA bin
  • Ich bin nicht auf den Philippinen wohnhaft
  • Ich weder direkt noch indirekt mehr als 10 % der Anteile/Stimmrechte/Beteiligungen der in USA ansässigen Personen besitze und/oder keine US-Bürger oder in den USA ansässigen Personen auf andere Weise kontrolliere
  • Ich mich nicht im direkten oder indirekten Besitz von mehr als 10 % der Aktien/Stimmrechte/Beteiligungen und/oder unter der Kontrolle eines US-Bürgers bzw. einer anderweitig in den USA ansässigen Person befinde.
  • Ich nicht mit US-Bürgern oder Personen mit Wohnsitz in den USA im Sinne von Abschnitt 1504 (a) des FATCA in Verbindung stehe bin
  • Ich bin mir meiner Haftung für die Abgabe einer falschen Erklärung bewusst.
Für die Zwecke dieser Erklärung werden alle von den USA abhängigen Länder und Territorien mit dem Hauptterritorium der USA gleichgesetzt. Ich verpflichte mich, Octa Markets Incorporated sowie seine Direktoren und leitenden Angestellten gegen alle Ansprüche zu verteidigen und schadlos zu halten, die sich aus einer Verletzung meiner vorliegenden Erklärung ergeben oder damit zusammenhängen.
Wir legen großen Wert auf Ihre Privatsphäre und die Sicherheit Ihrer persönlichen Daten. Wir erfassen Ihre E-Mail-Adresse nur, um Ihnen Sonderangebote und wichtige Informationen über unsere Produkte und Dienstleistungen zukommen zu lassen. Indem Sie Ihre E-Mail-Adresse angeben, erklären Sie sich damit einverstanden, solche E-Mails von uns zu erhalten. Wenn Sie den Newsletter abbestellen möchten oder Fragen bzw. Bedenken haben, wenden Sie sich bitte an unseren Kundensupport.
Octa trading broker
Konto eröffnen
Back

NZD/JPY Price Analysis: Buyers step back to consolidate, sellers gain ground

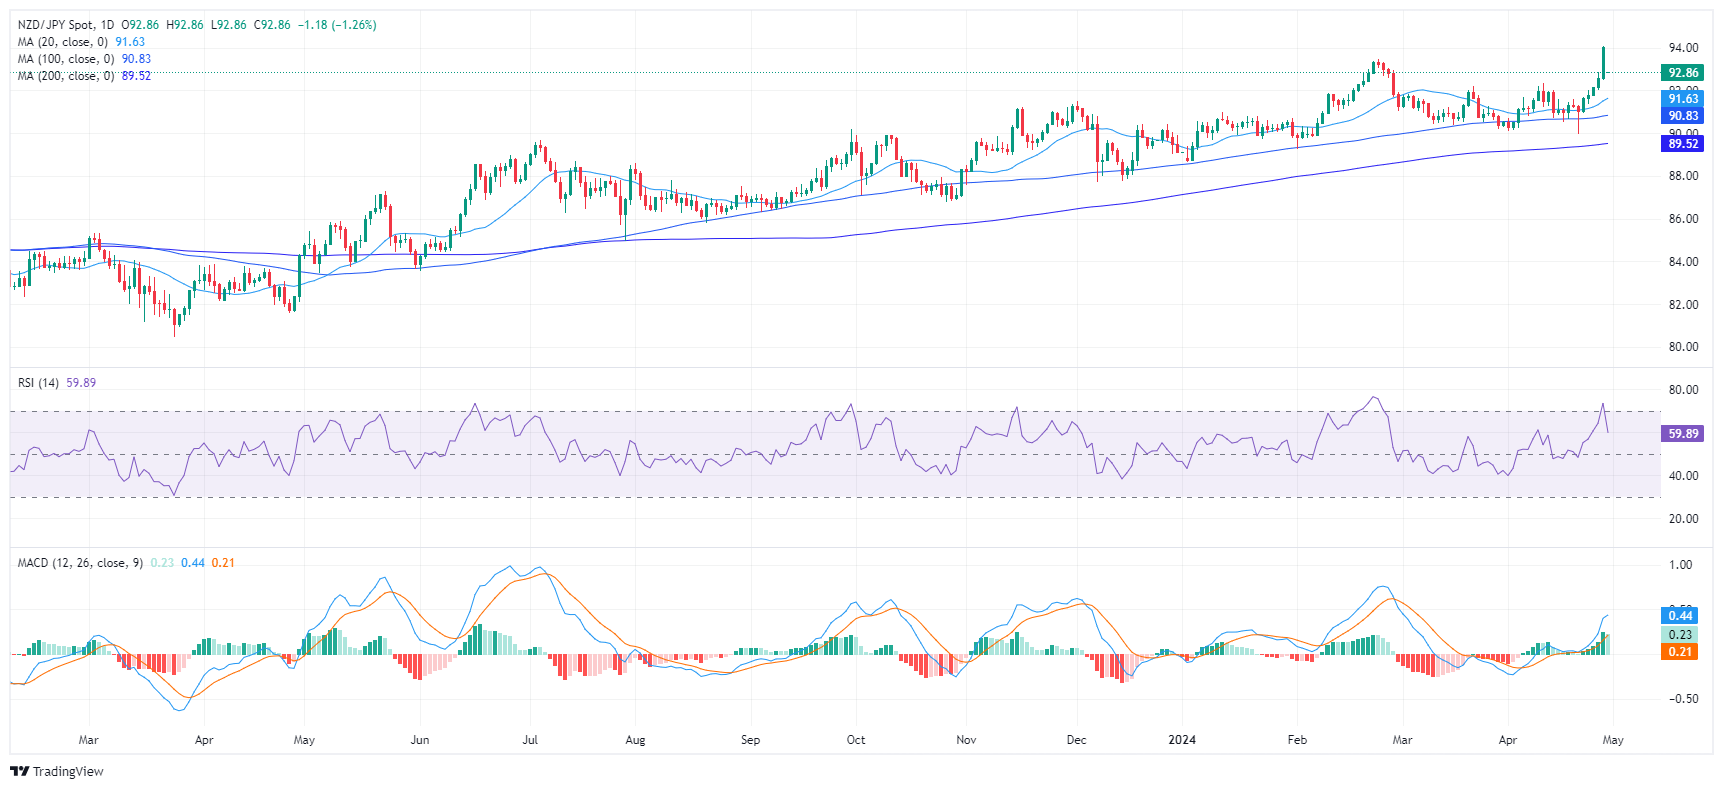
  • The daily RSI for the NZD/JPY shows a decreasing trend, hinting at a growing bearish bias.
  • On the hourly chart, both RSI and MACD reflect a growing bearish tendency, supporting the daily chart's sentiment.
  • Any movements that leave the pair above its 20-day SMA won’t challenge the bullish outlook.

The NZD/JPY pair is down by 0.45% on Tuesday, trading at 92.99. Despite some bearish undertones, the NZD/JPY maintains a long-term bullish trend above its principal Simple Moving Averages (SMAs). There is potential for short-term momentum shifts, as investors are stepping back to take profits after propelling the pair to highs since 2015 on Monday.

On the daily chart, the Relative Strength Index (RSI) for NZD/JPY has decreased over the previous sessions. The index moved from overbought terrain to below 70 indicating a possible reversal or slowdown in the buyer’s traction.

NZD/JPY daily chart
Moving to an intraday basis, the hourly chart presents a similar scenario. The  RSI plunged into negative territory. Simultaneously, the Moving Average Convergence Divergence (MACD) printed a red bars signaling a rising negative momentum. This indicates that investors continued taking profits on Tuesday and that the sellers commanded the trades during the session.

NZD/JPY hourly chart
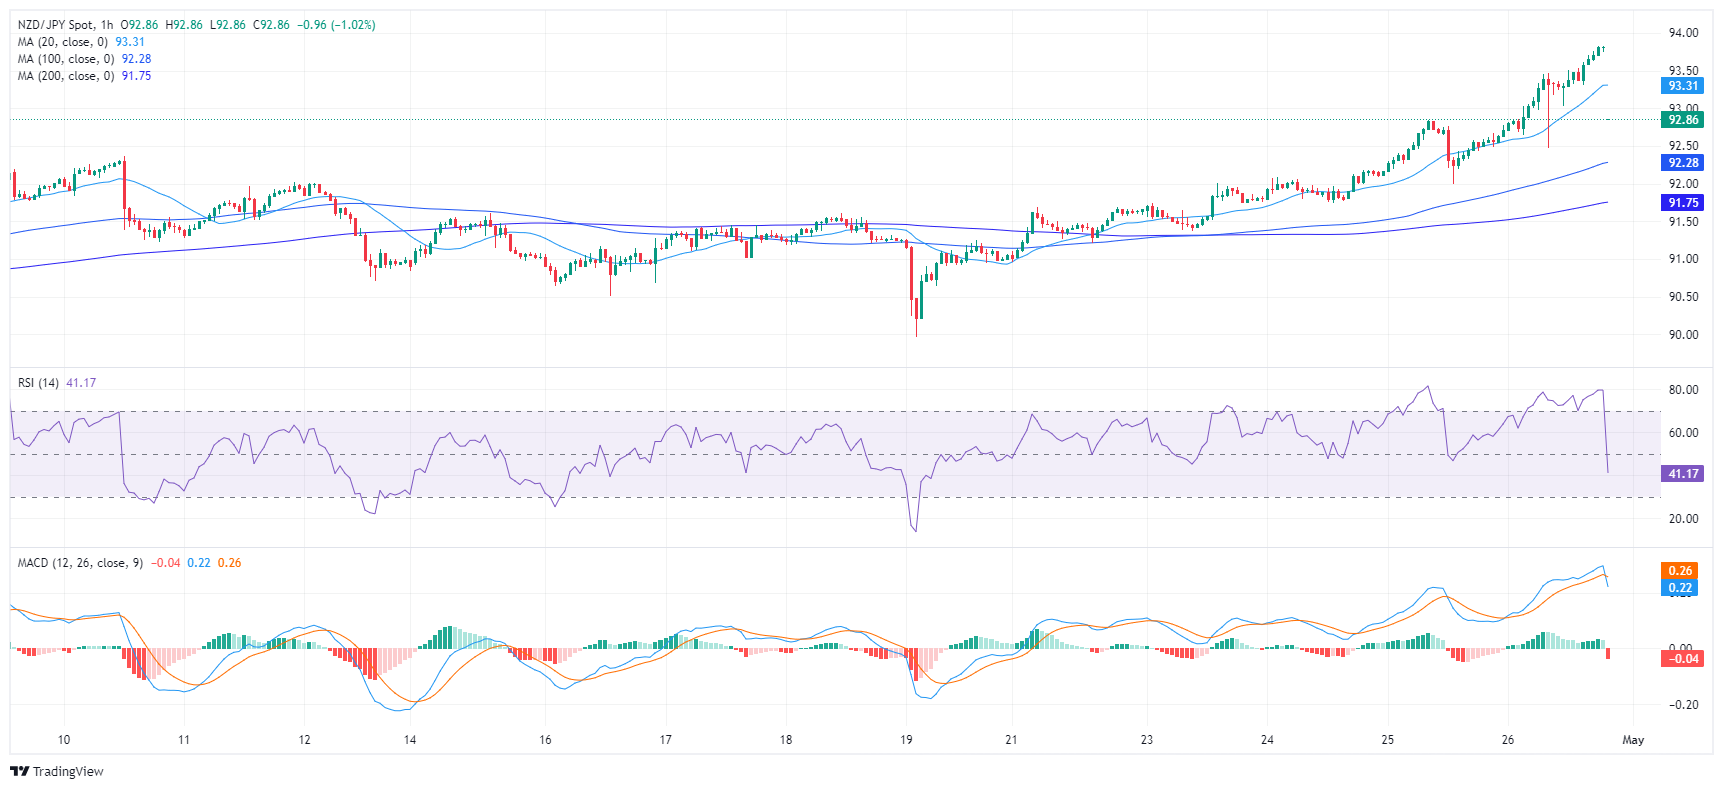
From a broader perspective, NZD/JPY remains bullish despite the downside as it remains above its Simple Moving Averages (SMA) of 20,100, and 200-day periods. However, if the bears manage to gather additional momentum they might reclaim the 20-day SMA which may worsen the outlook for the pair in case of being lost.


NZD/JPY

Overview
Today last price 92.91
Today Daily Change -0.54
Today Daily Change % -0.58
Today daily open 93.45
 
Trends
Daily SMA20 91.66
Daily SMA50 91.53
Daily SMA100 90.84
Daily SMA200 89.52
 
Levels
Previous Daily High 95.42
Previous Daily Low 92.2
Previous Weekly High 94.09
Previous Weekly Low 90.95
Previous Monthly High 92.2
Previous Monthly Low 90.17
Daily Fibonacci 38.2% 93.44
Daily Fibonacci 61.8% 94.19
Daily Pivot Point S1 91.96
Daily Pivot Point S2 90.47
Daily Pivot Point S3 88.74
Daily Pivot Point R1 95.18
Daily Pivot Point R2 96.91
Daily Pivot Point R3 98.4


Gold price retreats below $2,300 amid rising US ECI, US Dollar strength

Gold prices drop below the $2,300 threshold on Tuesday as data from the United States (US) show that employment costs are rising, thus putting upward pressure on inflation.
Mehr darüber lesen Previous

Silver Price Analysis: XAG/USD plunges over 3%, back beneath $27.00

Silver's price dropped sharply late in the North American session, as the Greenback staged a comeback bolstered by the rise in US Treasury yields.
Mehr darüber lesen Next