Confirming you are not from the U.S. or the Philippines

Mit der Abgabe dieser Erklärung erkläre und bestätige ich ausdrücklich, dass:
  • Ich kein Bürger oder Einwohner der USA bin
  • Ich bin nicht auf den Philippinen wohnhaft
  • Ich weder direkt noch indirekt mehr als 10 % der Anteile/Stimmrechte/Beteiligungen der in USA ansässigen Personen besitze und/oder keine US-Bürger oder in den USA ansässigen Personen auf andere Weise kontrolliere
  • Ich mich nicht im direkten oder indirekten Besitz von mehr als 10 % der Aktien/Stimmrechte/Beteiligungen und/oder unter der Kontrolle eines US-Bürgers bzw. einer anderweitig in den USA ansässigen Person befinde.
  • Ich nicht mit US-Bürgern oder Personen mit Wohnsitz in den USA im Sinne von Abschnitt 1504 (a) des FATCA in Verbindung stehe bin
  • Ich bin mir meiner Haftung für die Abgabe einer falschen Erklärung bewusst.
Für die Zwecke dieser Erklärung werden alle von den USA abhängigen Länder und Territorien mit dem Hauptterritorium der USA gleichgesetzt. Ich verpflichte mich, Octa Markets Incorporated sowie seine Direktoren und leitenden Angestellten gegen alle Ansprüche zu verteidigen und schadlos zu halten, die sich aus einer Verletzung meiner vorliegenden Erklärung ergeben oder damit zusammenhängen.
Wir legen großen Wert auf Ihre Privatsphäre und die Sicherheit Ihrer persönlichen Daten. Wir erfassen Ihre E-Mail-Adresse nur, um Ihnen Sonderangebote und wichtige Informationen über unsere Produkte und Dienstleistungen zukommen zu lassen. Indem Sie Ihre E-Mail-Adresse angeben, erklären Sie sich damit einverstanden, solche E-Mails von uns zu erhalten. Wenn Sie den Newsletter abbestellen möchten oder Fragen bzw. Bedenken haben, wenden Sie sich bitte an unseren Kundensupport.
Octa trading broker
Konto eröffnen
Back

AUD/JPY Price Analysis: Bulls steer the market towards 101.00, its highest since 2014

  • The daily RSI of the AUD/JPY continues its uphill journey, nearing overbought territory, amplifying buying traction.
  • Hourly indicators are also strong, with no signs of bears.
  • A healthy correction shouldn't be ruled out.

The AUD/JPY market showcases an increasingly bullish trend. The cross stabilized at 100.89 on Wednesday, after rallying to a high at 101.12, its highest since 2014. The general market interest leans towards the buyers as the pair follows an upward trend and surpasses significant levels. However, as the pair gained nearly 1.50% in the last sessions, the cross might be poised for a correction.

On the daily chart, the Relative Strength Index (RSI) of the AUD/JPY pair continues its upward trajectory nearing overbought territory. The Moving Average Convergence Divergence (MACD) also supports the buyers, as it prints a fresh green bar.
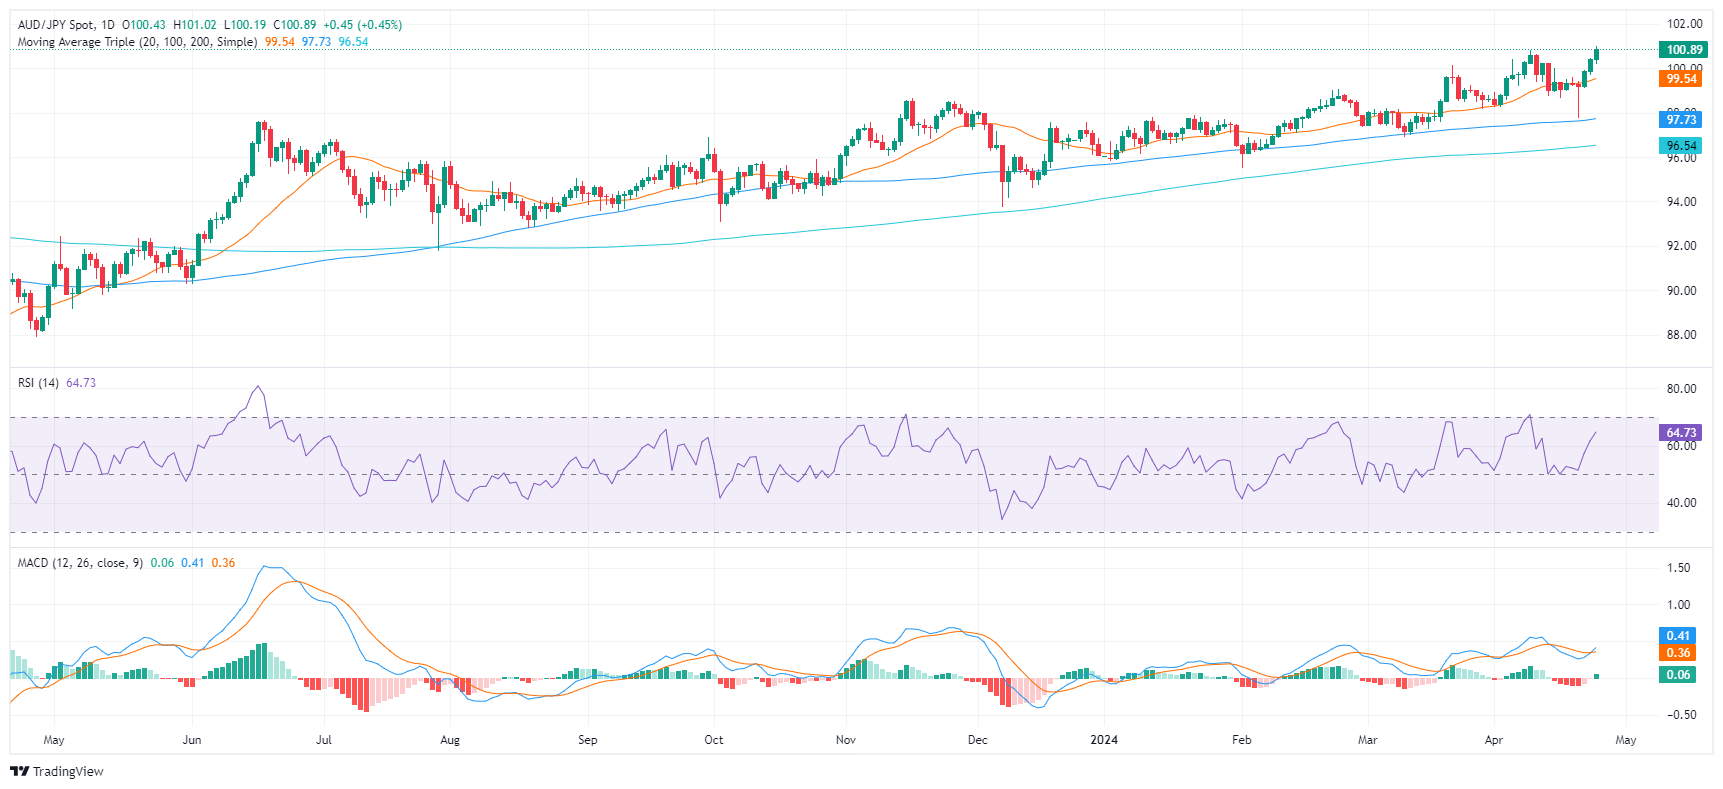
AUD/JPY daily chart

Switching the focus to the hourly chart, the hourly Relative Strength Index (RSI) displays a generally increasing trend, pointing toward positive short-term momentum. In addition, the MACD portrays decreasing red bars, denoting the declining momentum of the sellers in the short-term trading hours.
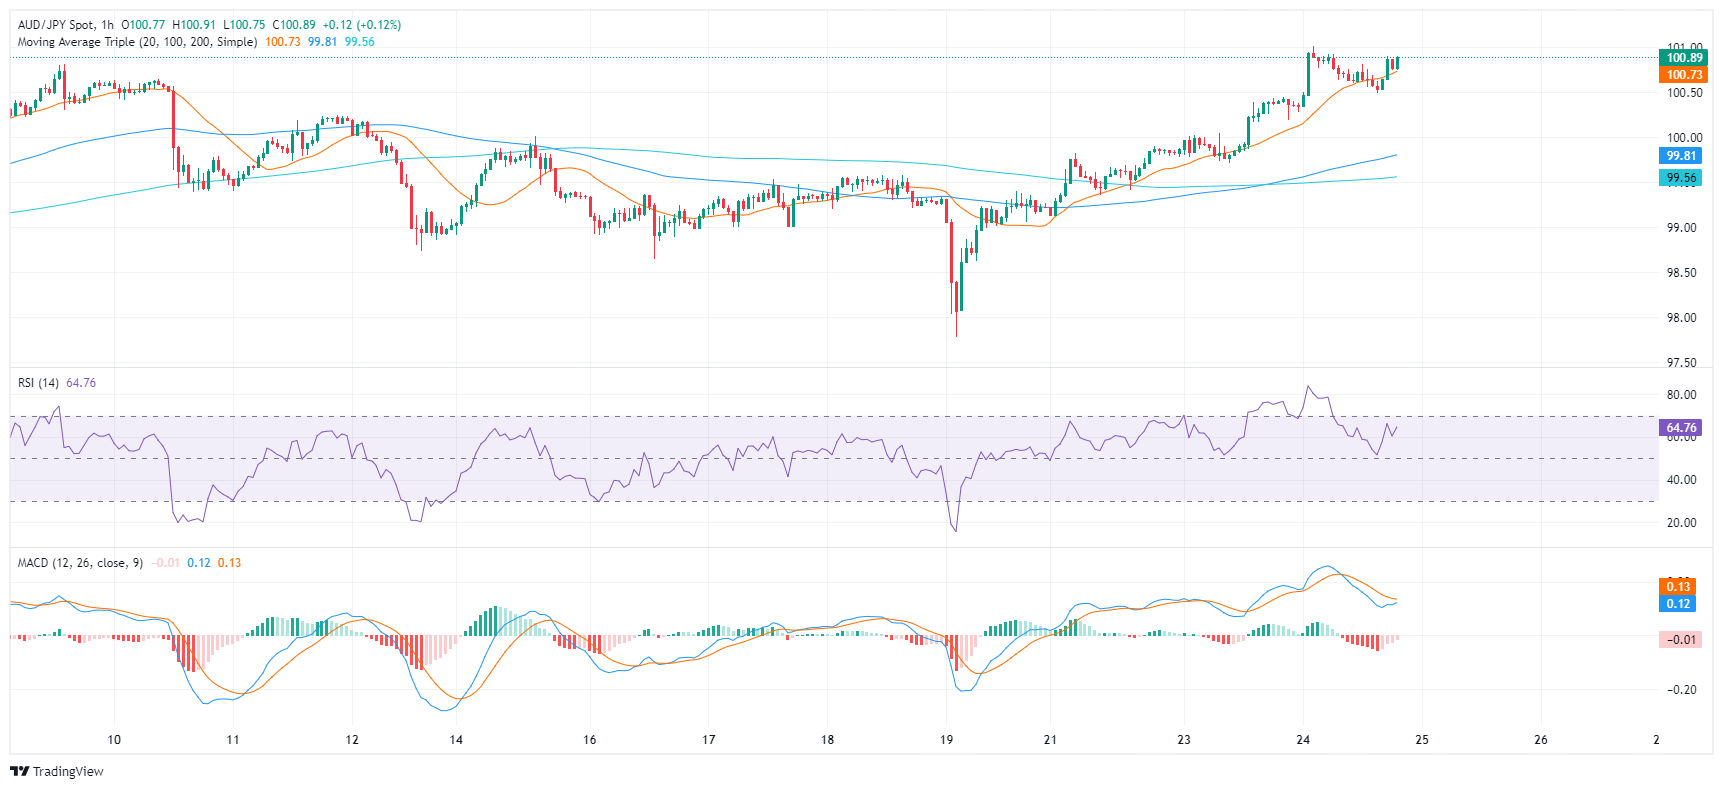
AUD/JPY hourly chart

In the broader outlook, the AUD/JPY indicates a bullish trend, given its current position above the 20, 100, and 200-day Simple Moving Average (SMA). SMAs serve as technical indicators for analyzing price trends by smoothing out price fluctuations. The pair's stance above all three SMAs suggests a strong stance from the bull in the short and long-term perspectives. In addition, the pair rallying to multi-year highs suggests that the bulls are clearly in command, but traders shouldn't be ruled out as indicators might run out of steam.


AUD/JPY

Overview
Today last price 100.89
Today Daily Change 0.46
Today Daily Change % 0.46
Today daily open 100.43
 
Trends
Daily SMA20 99.44
Daily SMA50 98.69
Daily SMA100 97.69
Daily SMA200 96.5
 
Levels
Previous Daily High 100.45
Previous Daily Low 99.71
Previous Weekly High 100.02
Previous Weekly Low 97.78
Previous Monthly High 100.17
Previous Monthly Low 96.9
Daily Fibonacci 38.2% 100.17
Daily Fibonacci 61.8% 99.99
Daily Pivot Point S1 99.94
Daily Pivot Point S2 99.46
Daily Pivot Point S3 99.21
Daily Pivot Point R1 100.68
Daily Pivot Point R2 100.94
Daily Pivot Point R3 101.42


Gold prices rebound with buyers capitalizing on dip as geopolitical tensions ease

Gold recovered some ground on Wednesday after posting back-to-back negative sessions during the beginning of the week as geopolitical risks abated.
Mehr darüber lesen Previous

WTI explores downside but remains close to $83 as Crude Oil markets froth

West Texas Intermediate (WTI) US Crude Oil slipped back slightly on Wednesday, stumbling away from $83.50 per barrel to trade down to $82.50 as broad-market risk appetite from Tuesday evaporates in the mid-week market session.
Mehr darüber lesen Next