Confirming you are not from the U.S. or the Philippines

Mit der Abgabe dieser Erklärung erkläre und bestätige ich ausdrücklich, dass:
  • Ich kein Bürger oder Einwohner der USA bin
  • Ich bin nicht auf den Philippinen wohnhaft
  • Ich weder direkt noch indirekt mehr als 10 % der Anteile/Stimmrechte/Beteiligungen der in USA ansässigen Personen besitze und/oder keine US-Bürger oder in den USA ansässigen Personen auf andere Weise kontrolliere
  • Ich mich nicht im direkten oder indirekten Besitz von mehr als 10 % der Aktien/Stimmrechte/Beteiligungen und/oder unter der Kontrolle eines US-Bürgers bzw. einer anderweitig in den USA ansässigen Person befinde.
  • Ich nicht mit US-Bürgern oder Personen mit Wohnsitz in den USA im Sinne von Abschnitt 1504 (a) des FATCA in Verbindung stehe bin
  • Ich bin mir meiner Haftung für die Abgabe einer falschen Erklärung bewusst.
Für die Zwecke dieser Erklärung werden alle von den USA abhängigen Länder und Territorien mit dem Hauptterritorium der USA gleichgesetzt. Ich verpflichte mich, Octa Markets Incorporated sowie seine Direktoren und leitenden Angestellten gegen alle Ansprüche zu verteidigen und schadlos zu halten, die sich aus einer Verletzung meiner vorliegenden Erklärung ergeben oder damit zusammenhängen.
Wir legen großen Wert auf Ihre Privatsphäre und die Sicherheit Ihrer persönlichen Daten. Wir erfassen Ihre E-Mail-Adresse nur, um Ihnen Sonderangebote und wichtige Informationen über unsere Produkte und Dienstleistungen zukommen zu lassen. Indem Sie Ihre E-Mail-Adresse angeben, erklären Sie sich damit einverstanden, solche E-Mails von uns zu erhalten. Wenn Sie den Newsletter abbestellen möchten oder Fragen bzw. Bedenken haben, wenden Sie sich bitte an unseren Kundensupport.
Octa trading broker
Konto eröffnen
Back

Gold Price Forecast: XAU/USD continues to juggle above $1,900 despite US Inflation softens

  • Gold price is struggling to come out of the woods despite the continuation of declining US Inflation.
  • The USD Index is defending the critical support of 103.50 but looks prone to the further downside amid the risk-on mood.
  • Monthly US Retail Sales data is expected to contract by 0.3% vs. the former release of 3% expansion.

Gold price (XAU/USD) is inside the woods despite the United States inflation figures meeting expectations. The precious metal is continuously oscillating in a narrow range of $1,895-1,913 from Monday. The release of the US Consumer Price Index (CPI) failed to deliver a power-pack action in the Gold price, however, the upside bias looks solidified as bets for smaller rate hikes from the Federal Reserve (Fed) have soared.

The US Dollar Index (DXY) is defending the critical support of 103.50 but looks prone to the further downside as investors’ risk appetite has improved dramatically. S&P500 futures witnessed responsive buying from the market participants as higher odds of a smaller rate hike from Fed chair Jerome Powell might postpone a likely recession in the US economy, portraying a sheer recovery in overall optimism.

Contrary to the risk-on mood, the demand for US Treasury bonds remained vulnerable, which led the 10-year US Treasury yields higher above 3.68%.

The headline US CPI was expanded by 0.4% on a monthly basis, as expected and the annual figure softened to 6.0% from the former release of 6.4%.  And, the core CPI that excludes oil and food prices dropped marginally to 5.5% from the former release of 5.6%. The continuation of a declining trend in the US inflation seems delightful for the Fed.

Going forward, investors will keep an eye on the US Retail Sales (Feb) data. Monthly Retail Sales data is expected to contract by 0.3% vs. the former release of 3% expansion. This indicates that resilience in consumer spending is over and the Fed is on track of achieving the 2% inflation target.

Gold technical analysis

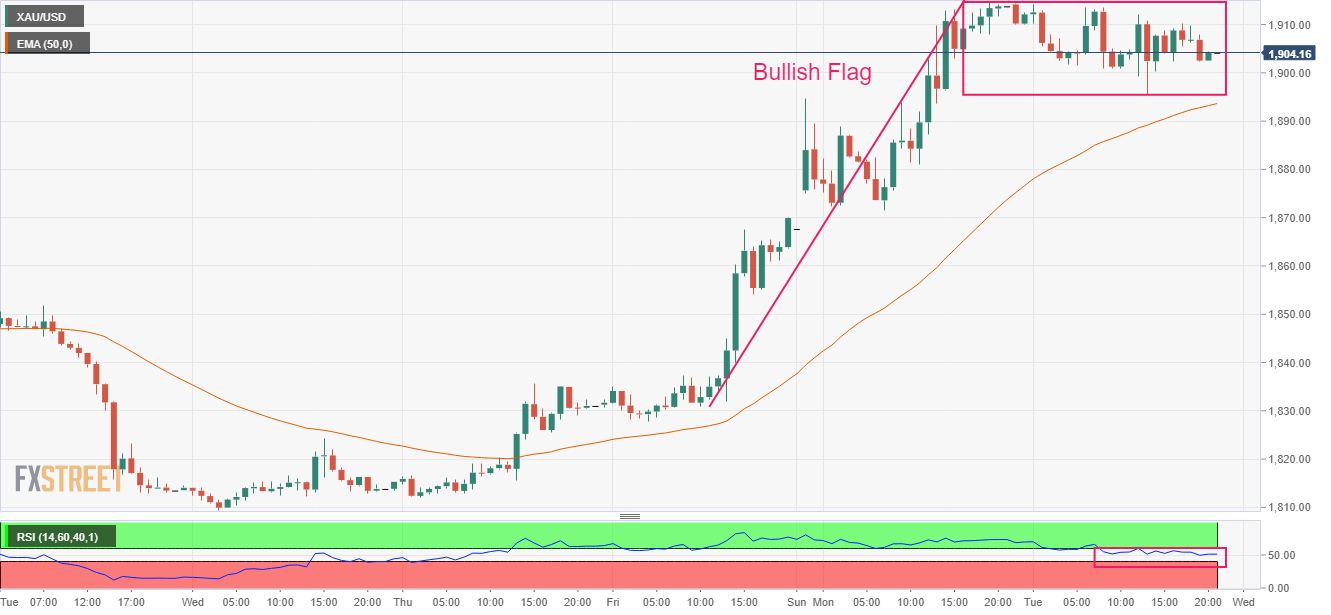
Gold price is forming a Bullish Flag chart pattern on an hourly scale, which indicates a continuation of the bullish momentum after the breakout of a consolidation. Usually, the consolidation phase of the chart pattern serves as an inventory adjustment in which those participants initiate longs, which prefer to enter an auction after the establishment of a bullish bias.

Advancing 50-period Exponential Moving Average (EMA) at $1,894.00 add to the upside filters.

The Relative Strength Index (RSI) (14) is oscillating in a bullish range of 40.00-60.00. A break into the bullish range of 60.00-80.00 will trigger the upside momentum.

Gold hourly chart


USD/JPY Price Analysis: Bullish correction in full-flight, 135´s eyed

USD/JPY is making its way north following confirmation that inflation is sticky in the US from the day´s Consumer Price Index outcome earlier in the U
Mehr darüber lesen Previous

NZD/USD Price Analysis: Bulls run out of steam as key EMAs test upside near 0.6250

NZD/USD seesaws around 0.6235-30 during the early Wednesday morning in Asia-Pacific as bulls jostle with the key Exponential Moving Averages (EMA) to
Mehr darüber lesen Next