
Unsere besten Spreads und Konditionen
 Über die Plattform

Gold price (XAU/USD) drops for the third consecutive day as it drops to the lowest level in one week amid a broad US Dollar strength. It’s worth noting that the yellow metal dropped the most in a month the previous day after Federal Reserve (Fed) Chairman Jerome Powell surprised traders on Tuesday by showing readiness for more rate hikes and bolstered the bets of a 50 bps Fed rate hike in March. The policymaker propelled the “higher for longer” Fed rate expectations and bolstered the US Treasury bond yields while weighing on the XAU/USD.
That said, the US 10-year Treasury bond yields rose 0.15% while closing around 3.97% on Tuesday but the two-year counterpart gained 2.60% on a day when poking the highest levels since 2007, to 5.02% at the latest. With this, the yield curve inversion widened the most in 42 years and drowned the Gold price. Apart from the Fed and bond market plays, the Sino-American tension over Taiwan and the recent US upbeat data also exert downside pressure on the XAU/USD price.
Moving on, Fed Chair Powell’s second round of testimony and the US ADP Employment Change, the early signal for Friday’s US Nonfarm Payrolls (NFP), will be crucial for clear directions.
Also read: Gold Price Forecast: XAU/USD set for more pain if key $1,805-$1,800 support zone fails
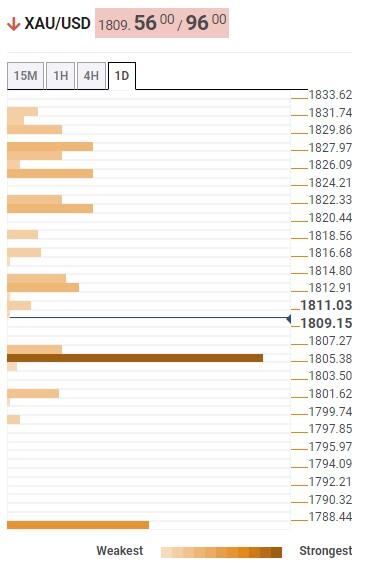
The Technical Confluence Detector shows that the Gold price slides towards the key $1,805 support confluence comprising the 100-DMA, the lows marked during the previous month and the last week, as well as the lower band of the Bollinger on the daily chart.
It should be noted that the Pivot Point one-day S1 highlights the $1,800 threshold as an extra filter towards the south before directing the XAU/USD bears toward the late 2022 bottom surrounding $1,775.
Meanwhile, the previous daily low and 10-HMA together portray the $1,815 level as the immediate upside hurdle for the Gold price.
Following that, the Pivot Point one week S1 and Fibonacci 23.6% on one-day, around $1,823, could probe the XAU/USD bulls.
It should be noted that the Fibonacci 61.8% in one-week and Fibonacci 38.2% on one-day, around $1,825 and $1,828, could act as the last defenses of the Gold bears.
The TCD (Technical Confluences Detector) is a tool to locate and point out those price levels where there is a congestion of indicators, moving averages, Fibonacci levels, Pivot Points, etc. If you are a short-term trader, you will find entry points for counter-trend strategies and hunt a few points at a time. If you are a medium-to-long-term trader, this tool will allow you to know in advance the price levels where a medium-to-long-term trend may stop and rest, where to unwind positions, or where to increase your position size.


